The table above shows data on two variables. If these data were graphed, the slope of the line would be
A) 1/2.
B) 4/3.
C) 2/3.
D) 3/4.
E) 2.
D
You might also like to view...
Refer to the figure below. In response to gradually falling inflation, this economy will eventually move from its short-run equilibrium to its long-run equilibrium. Graphically, this would be seen as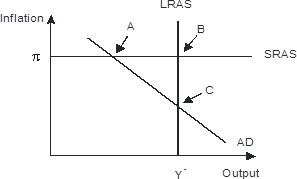
A. long-run aggregate supply shifting leftward B. Short-run aggregate supply shifting downward C. Aggregate demand shifting rightward D. Aggregate demand shifting leftward
Control of a scarce resource or input can serve as an entry barrier
a. True b. False Indicate whether the statement is true or false
The value of the marginal product of labor is calculated by multiplying the
a. price of output by the quantity of labor. b. price of output by the marginal product of labor. c. wage by the quantity of labor. d. wage by the marginal product of labor.
What happens to the aggregate expenditure curve as the price level decreases?
a. It shifts up. b. It shifts down. c. It remains unchanged. d. It becomes steeper.