Consider the following data set:
150 82 15 12 27 33 98 33 75 1
30 17 3 66 55 45 7 99 58 32
44 34 2 33 17 13 10 25 0 90
66 43 42 18 93 38 20 113 35 23
a. Construct a normal probability plot for these data. Do they appear to come from an approximately normal distribution?
b. Transform the data by taking the square root of each value in the data set. Show that the square roots appear to come from an approximately normal distribution.
(a)
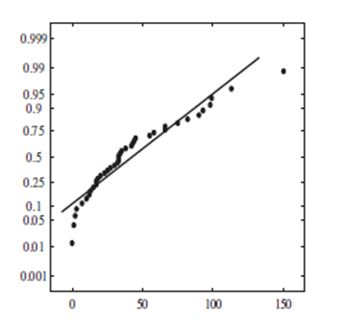
The data do not come from an approximately normal distribution.
(b)
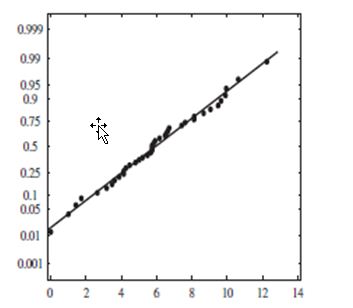
The square roots come from an approximately normal distribution.
You might also like to view...
List three methods of restraining animals for observation and treatment
What will be an ideal response?
The site analysis can help suggest uses for the land that had not occurred to the client
Indicate whether the statement is true or false
The top and bottom horizontal members of a wall frame are called ____.
a.jacks b.trimmers c.plates d.sills
List the four phases of a planned maintenance service call
What will be an ideal response?