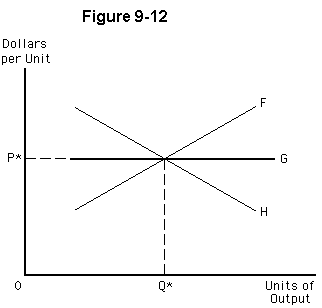
Figure 9-12 shows three possible long-run supply curves for an industry that is currently in equilibrium with price (P*) and quantity (Q*). Which of the following statements is correct?
a.
The long-run supply curve would be F for a decreasing-cost industry, H for an increasing-cost industry, and G for a constant-cost industry.
b.
All three long-run supply curves indicate that the firms' LRATC curves shift as industry output expands.
c.
If the industry uses a significant portion of a scarce input, the long-run supply curve would likely be curve H.
d.
An industry that moves along long-run supply curve F earns above-normal profits in the long run.
e.
If an increase in market output leads to lower prices for a key input, the long-run supply curve would likely be curve H.
e
You might also like to view...
The market demand curve for any good is:
a. independent of individuals' demand curves for the good. b. the vertical summation of individuals' demand curves. c. the horizontal summation of individuals' demand curves. d. derived from the firm's marginal cost of production.
It was once common for people to have servants who helped with the cooking and cleaning. Use the cost disease of the personal services dilemma to explain why these services have declined, even though one would expect an increased use in this age of the two-worker household
Opportunities created by trade:
A) induce a greater degree of specialization. B) are evidenced by higher opportunity costs of production. C) are a result of absolute advantage. D) are few and far between.
The market under produces public goods because:
a) Of concerns about equity. b) People do not want public goods as much as private goods. c) The government is mandated to produce public goods. d) People are less willing to pay for public goods than for private goods.