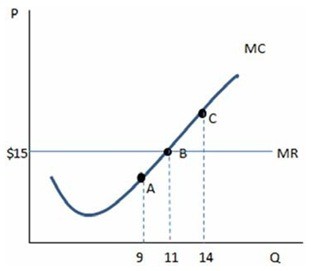
 According to the graph shown, the profits at point A are:
A. higher than those at point B.
B. the same as those at point B.
C. higher than those at point C.
D. lower than those at point B.
Answer: D
You might also like to view...
Tacos and pizza are substitutes. If a 2 percent change in the price of a taco leads to a 4 percent change in the demand for pizza, the cross elasticity of demand equals
A) -1/2. B) 1/2. C) 2. D) -2. E) 4.
Managers of profit centers are usually given a lot of discretion because
a. They always do an excellent job b. They rarely do a good job c. The company can never judge their performance d. It is relatively easy to tie management pay to division performance
The figure below shows the production-possibility curves of Canada (AB) and the rest of the world (CD). I1 and I2 are community indifference curves for Canada and the rest of the world. In the absence of trade, the rest of the world produces ________ bales of cotton and ________ bushels of wheat.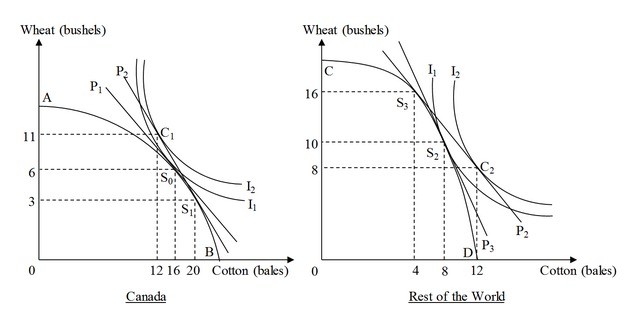
A. four; sixteen B. eight; ten C. twelve; eight D. ten; eight
Distinguish the short run from the long run. Generally, what causes costs of production to vary with output in the short run? What generally causes costs of production to vary in the long run?
What will be an ideal response?