If the graph shown is displaying a competitive labor market:
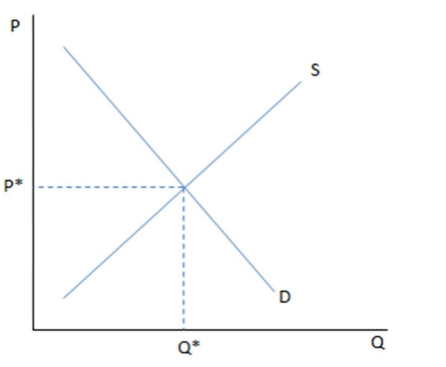
A. D would represent the workers' demand for jobs at each wage.
B. Q* would represent the equilibrium wage.
C. P* would represent how many people are employed in the market.
D. Q* would represent the equilibrium number of workers in the market.
D. Q* would represent the equilibrium number of workers in the market.
You might also like to view...
The balance of trade is
A) the difference between exports and imports of goods and services. B) the difference between exports and imports of services. C) the summary record of a country's economic transactions with foreigners in a year. D) none of the above.
The nature of health care delivery will be different in the future due to:
a. a rising percentage of elderly in the total population. b. cheaper alternatives to treatments in oncology. c. an expected increase in the fertility rate. d. longer inpatient hospital stays due to an decrease in acute illnesses among the elderly population. e. longer lives due to a lower incidence of chronic illness
Government intervention in the market
A. Always involves an opportunity cost. B. Results in the free-rider dilemma. C. Does not involve an opportunity cost if market outcomes are improved. D. Never involves an opportunity cost because only market activities result in other goods and services being given up.
Which of the following describes Jonathan having a comparative advantage in producing apples?
What will be an ideal response?