Use the following graph for a monopolistically competitive firm to answer the next question. 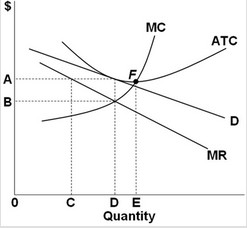 Excess capacity for this firm would be illustrated by the quantity
A. E - D.
B. D - 0.
C. D - C.
D. E - C.
Answer: A
You might also like to view...
Refer to Figure 9-5. The tariff causes domestic consumption of coffee
A) to fall by 7 million pounds. B) to rise by 6 million pounds. C) to fall by 27 million pounds. D) to rise by 20 million pounds.
Employing Figure 3-1 above, autonomous consumption expenditures are ________, and the marginal propensity to consume is ________
A) 200; 0.75 B) 500; 1 C) 200; 0.60 D) 0; 1
If average cost is positive,
A) marginal cost equals average cost. B) marginal cost exceeds average cost. C) marginal cost is less average cost. D) Not enough information is provided.
Refer to the graph below with three demand curves. An "increase in quantity demanded" would be illustrated by a change from:
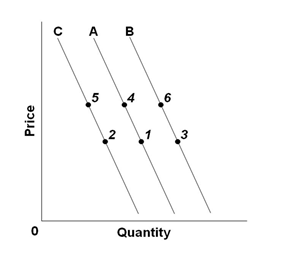
A. Point 4 to point 6
B. Point 5 to point 1
C. Point 4 to point 1
D. Point 2 to point 5