A new chocolate company is estimating how many candy bars per week college students will consume of their line of products. The graph shows the probable number of candy bars students (age 18-22) will consume from year 0 to year 10. B(x) gives the number of candy bars for boys, G(x) gives the number of candy bars for girls, and T(x) gives the total number for both groups. Use the graph to answer the question.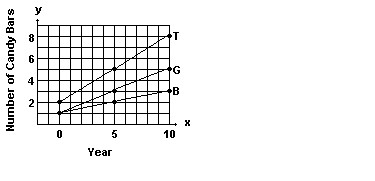 Estimate B(4) and G(4) and use your estimates to estimate T(4).
A. 1.8; 2.5; 4.3
B. 2.0; 3.0; 5.0
C. 1.5; 2.5; 4.0
D. 2.0; 2.8; 4.8
Answer: D
You might also like to view...
Find all the roots of the function. Use preliminary analysis and graphing to determine good initial approximations. Round to six decimal places.f(x) = csc x - 5x on [0, 4]
A. x ? 0.454942, 3.076428 B. x ? 0.455053, 3.076539 C. x ? 0.565064, 2.966528 D. x ? 0.565053, 3.186539
Choose the model that matches the described situation.The distance a fisherman is from shore if he sits anchored 500 yards out for 30 minutes and then rows to shore at a constant speed for 45 minutes.
A. 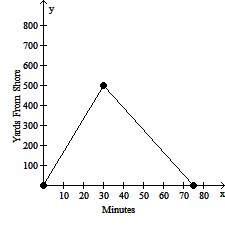
B. 
C. 
D. 
Write the logarithmic equation as an exponential equation.ln x = 9
A. 9e = x B. ex = 9 C. e9 = x D. x9 = e
Provide an appropriate response.Two painters painted a house in 8 days, while four painters painted a similar house in 4 days. Determine whether the situation reflects direct variation or inverse variation.
A. Direct variation B. Inverse variation