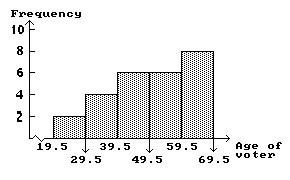
Construct the specified histogram.In a survey, 26 voters were asked their age. The results are shown below. Construct a histogram to represent the data. Use 5 classes.43 56 28 63 67 66 52 48 37 51 40 60 62 66 45 21 35 49 32 53 61 53 69 31 48 59 
What will be an ideal response?
You might also like to view...
In the following ?ABC, where?3 is the exterior angle of ?B the following must be true:
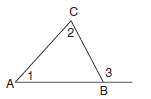
(a) <1 > <2
(b) <3 > <2
(c) <3 > <1
(d) <2 > <1
(e) <1 > <2 = <3
(f) Both (a) and (b) are correct.
(g) Answers (b), (c) and (e) are all correct.
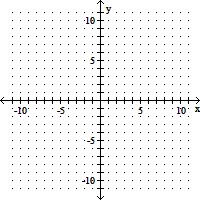
Graph the solution of the system of linear inequalities.
A. 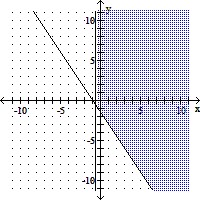
B. 
C. 
D. 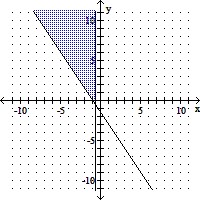
Analyze the graph of the given function f as follows:(a) Determine the end behavior: find the power function that the graph of f resembles for large values of |x|.(b) Find the x- and y-intercepts of the graph.(c) Determine whether the graph crosses or touches the x-axis at each x-intercept.(d) Graph f using a graphing utility.(e) Use the graph to determine the local maxima and local minima, if any exist. Round turning points to two decimal places.(f) Use the information obtained in (a) - (e) to draw a complete graph of f by hand. Label all intercepts and turning points.(g) Find the domain of f. Use the graph to find the range of f.(h) Use the graph to determine where f is increasing and where f is decreasing.f(x) = src="https://sciemce.com/media/4/ppg__ttt0521190955__f1q163g1.jpg" style="vertical-align: -17.0px;" />x3 -  x2 - 3x + 15
What will be an ideal response?
Find the indicated roots. Write the answer in a + bi form.Cube roots of -8i
A. -2i,  - i,
- i,  - i
- i
B. 2i, -  - i,
- i,  - i
- i
C. 2i, -  + i, -
  + i
+ i
D. -2i,  + i,
+ i,  + i
+ i