How would the Great Recession of 2007–2009 be pictured in a typical production possibilities curve?
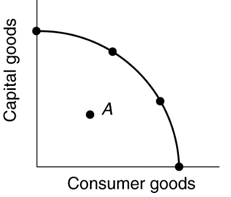
In a typical production possibilities curve, consumer goods would be on one axis and capital goods on another axis. A curved line bowed out from the origin would represent production possibilities for the United States. During the Great Recession of 2007–2009, the U.S. economy was not located on the frontier of its production possibilities, but rather at an interior point inside its production possibilities. This could be represented by a point similar to A. This point indicates that the U.S. economy was not producing what it was capable of producing had there been full employment of resources.
You might also like to view...
What is the commodity substitution bias? What effect does it have on the CPI?
What will be an ideal response?
The bias in the CPI typically
A) overstates inflation. B) understates inflation. C) about half the time overstates and about half the time understates the inflation rate. D) cannot be measured or estimated.
The Ricardian two-country two-good model predicts that there are potential benefits from trade, but NOT
A) the effect of trade on income distribution. B) the mechanism that determines which country will specialize in which good. C) when one country has an absolute advantage in the production of both goods. D) when one country has significantly lower wages than the other country. E) when both countries have the same types of technology available.
The OPEC crisis caused the aggregate demand curve to shift to the left
Indicate whether the statement is true or false