Solve the problem.The following data represents the average monthly minimum temperature for a certain city in California. 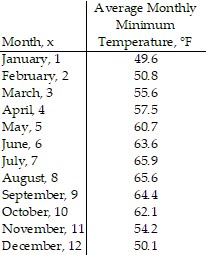 Draw a scatter diagram of the data for one period. Find a sinusoidal function of the form
  that fits the data. Draw the sinusoidal function on the scatter diagram. Use a graphing utility to find the sinusoidal function of best fit. Draw the sinusoidal function of best fit on the scatter diagram.
What will be an ideal response?
y = 8.33 sin (0.50x - 2.06) + 57.97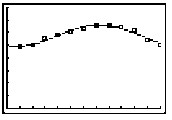
You might also like to view...
A bakery buys various types of nuts as ingredients for cookies. What is the cost of 26 pounds of peanuts if the price per pound of peanuts is $2.37?
A. $61.62 B. $43.70 C. $6.16 D. $4.37 E. none of the above
Determine the number of terms and name the coefficients of the terms.x4
A. 1; 1 B. 0 C. 1; 0 D. 1; 4
Solve.Mr. Buttimer took a plane trip for a total of 4.20 hours. He watched an  movie for 2.88 hours. From the airport, he took a cab ride for 0.20 hour to the train station. Next, he took the train home for 1.30 hours. What was the total time spent traveling?
A. 5.58 hours B. 5.70 hours C. 8.58 hours D. 4.70 hours
Describe the transformations required to obtain the graph of the function f(x) from the graph of the function g(x).f(x) = -2 cos  ; g(x) = cos x
A. Horizontal shrink by a factor  vertical shrink by a factor of
  , reflection across y-axis
B. Horizontal stretch by a factor  , vertical stretch by a factor of 2, reflection across x-axis
C. Horizontal shrink by a factor  , vertical stretch by a factor of 2, reflection across x-axis
D. Horizontal stretch by a factor  , vertical stretch by a factor of 2, reflection across y-axis