Refer to the information provided in Figure 2.4 below to answer the question(s) that follow.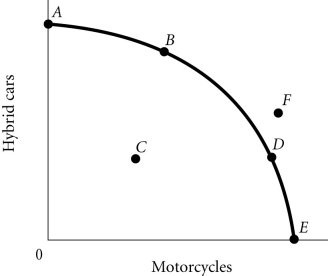 Figure 2.4According to Figure 2.4, an increase in unemployment may be represented by the movement from
A. B to A.
B. A to C.
C. C to D.
D. B to D.
Answer: B
You might also like to view...
Use the information below to explain adjustments that move the economy to a long-run equilibrium. Assume that firms and workers have adaptive expectations
The current unemployment rate = 7%. The natural rate of unemployment = 5.5%. Last year's inflation rate = 5%. This year's inflation rate = 4%.
If a 10 percent decrease in the price of product A brings about a 3 percent increase in the sales of product B, then:
a. products A and B are complementary. b. the cross elasticity of demand between these two products is positive. c. products A and B are substitutes. d. the demand for these products is inelastic. e. the total revenue earned from product A will decrease.
Which of the following goods is the best example of a public good?
a. garbage-collection services that are provided by a municipal government b. music that is broadcast over the airwaves by a privately-owned FM radio station c. electricity that is provided to farmhouses by a rural electric cooperative d. cable TV services that are provided by a privately-owned firm that is regulated by the government of the city in which it operates
The domestic demand and supply for sugar are Qd = 60,000 ? 400P and QSD = 20,000 + 500P. The foreign supply is QSF = 20,000 + 100P. Suppose an import quota of 13,000 is imposed in the domestic market. What will be the new market price of sugar?
A. $30 B. $15 C. $45 D. $20