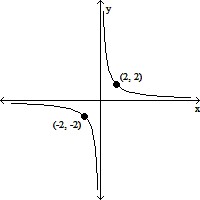
The graph of the function y = f(x) is given below. Sketch the graph of y =  .
.
A. 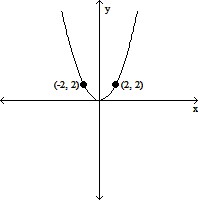
B. 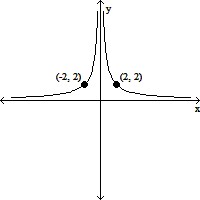
C. 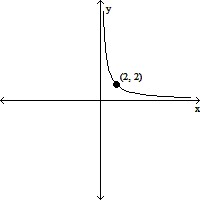
D. 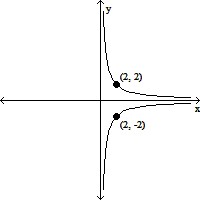
Answer: B
You might also like to view...
Solve the problem.The delivery of a drug (such as an antibiotic) through an intravenous line may be modeled by the differential equation src="https://sciemce.com/media/4/ppg__tttt0613190828__f1q11g5.jpg" alt="" style="vertical-align: -4.0px;" /> are solutions increasing? decreasing? What is the equilibrium solution?
A. increasing for A < 40 and decreasing for A > 40; m(t) = 40
B. increasing for A > 40 and decreasing for A < 40; m(t) = 40
C. increasing for A < 40 and decreasing for A > 40; m(t) = 0
D. increasing for A > 40 and decreasing for A < 40; m(t) = 0
 where m(t) is the mass of the drug in the blood at time
  k is a constant that describes the rate at which the drug is absorbed, and I is the infusion rate. Let
  and
and  For what initial values
Provide an appropriate response.Sketch the region described by the inequalities 
What will be an ideal response?
The graph below is one complete cycle of the graph of an equation containing a trigonometric function. Find an equation to match the graph. If you are using a graphing calculator, graph your equation to verify that it is correct.
?
 ?
?
A. 
B. ?
C. ?
D. ?
E. ?
Assume that the demand function for tuna in a small coastal town is given by
?
 ?
where q is the number of pounds of tuna that can be sold in 1 month at the price of p dollars per pound. The town's fishery finds that the demand for tuna is currently 900 pounds per month and is increasing at a rate of 200 pounds per month. How fast is the price changing? Round your answer to the three decimal places.
?
?
where q is the number of pounds of tuna that can be sold in 1 month at the price of p dollars per pound. The town's fishery finds that the demand for tuna is currently 900 pounds per month and is increasing at a rate of 200 pounds per month. How fast is the price changing? Round your answer to the three decimal places.
?
A. -$0.206 per pound per month B. -$5.556 per pound per month C. -$0.617 per pound per month D. -$0.412 per pound per month E. -$0.274 per pound per month