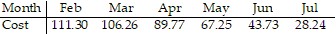
Solve the problem.The data below represent the average monthly cost of natural gas in an Oregon home. 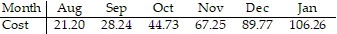
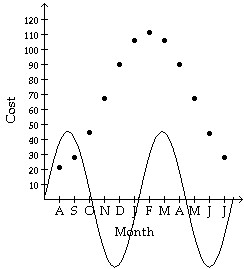 Above is the graph of 45.05 sin x superimposed over a scatter diagram of the data. Find the sinusoidal function of the form
 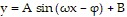 which best fits the data.
A. y = 45.05 sin  + 21.20
B. y = 45.05 sin  + 21.20
C. y = 45.05 sin  + 66.25
D. y = 45.05 sin  + 66.25
Answer: D
Mathematics
You might also like to view...
?Which of the following is not a linear function? ?
A. ?y = 4x
B. ?3x + y = 8
C. ?
| Input | Output |
| 1 | 8 |
| 2 | 16 |
| 3 | 24 |
D. ?
| Input | Output |
| –3 | 1 |
| –2 | 2 |
| 0 | 4 |
E. ?y = x2
Mathematics
Solve the system of equations by the elimination method. Check your solutions. For any dependent equations, write your answer in ordered pair form.
A. {(-7, 0), (-7, 7)} B. {(7, 7), (-7, 7)} C. {(7, 0), (7, 7)} D. {(7, 0), (-7, 0)}
Mathematics
Answer the question.If the graphs of a system of two equations are both parabolas, what are the possible numbers of solutions (with real coordinates) of this system?
Fill in the blank(s) with the appropriate word(s).
Mathematics
Convert to an expression using radical notation.(x2 - 5)-1/2
A. 
B. - 
C. 
D. 
Mathematics