The bar graph shows the number of new residents in several towns during the years 1999 to 2001. Use the graph to answer the question. 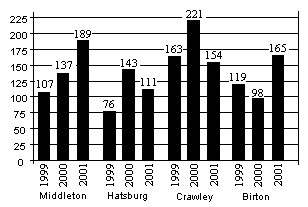 In the year 2000, how many more new residents did Crawley have than Middleton?
A. 78
B. 84
C. 32
D. 35
Answer: B
Mathematics
You might also like to view...
Solve the problem.The size of a population of mice after t months is P = 100(1 + 0.2t + 0.02t2). Find the growth rate at  months.
A. 48 mice/month B. 192 mice/month C. 196 mice/month D. 96 mice/month
Mathematics
Solve the problem.Forty-three drivers start a race. Assuming all the drivers are equally skilled, how many top ten finishes are possible?
A. 33!
B. 33
C. 
D. 
E. none of these
Mathematics
Convert the units.144 mm =  cm
cm
A. 14.4 cm B. 14,400 cm C. 1.4 cm D. 1440 cm
Mathematics
Find the percent change if a quantity changes from P1 to P2. Round your answer to the nearest tenth if appropriate.P1 = $18, P2 = $55
A. -67.3 B. 205.6 C. -205.6 D. 67.3
Mathematics