The figure above shows the demand curve for pizza. Using the midpoint method and moving from point A to point B, calculate the
a) percentage change in price.
b) percentage change in quantity demanded.
c) price elasticity of demand.
a) Between points A and B, the price falls 40 percent.
b) Between points A and B, the quantity increases 10 percent.
c) The price elasticity of demand is 0.25.
You might also like to view...
Information technologies are a ________ for low-skilled labor and a ________ for high-skilled labor
A) substitute; substitute B) complement; complement C) substitute; complement D) complement; substitute
A strategy is dominant if
A) it yields a greater payoff than any other player receives. B) it yields a payoff at least as large as that from any other strategy, regardless of the actions of other players. C) the player cannot gain by changing strategy, assuming that no other player changes strategy D) it is part of a Nash equilibrium.
The slope of the consumption function equals the
a. price elasticity of demand. b. marginal propensity to consume. c. marginal rate of investment. d. marginal propensity to save.
Refer to the given data. At the profit-maximizing level of employment, this firm's total revenue will be:
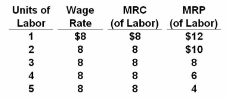
A. $16.
B. $32.
C. $24.
D. $30.