Answer the question based on the given graph.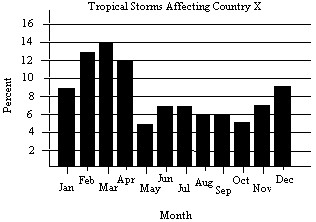 The data used to determine the graph were based on the number of tropical storms affecting Country X during the last ten years. A total of 683 tropical storms were reported. How many more tropical storms occurred during April than September? Round your answer to the nearest whole number, if necessary.
A. 55
B. 14
C. 41
D. 68
Answer: C
Mathematics
You might also like to view...
Solve the problem.How long will it take for an investment to double in value if it earns 4.25% compounded continuously? Round your answer to three decimal places.
A. 17.715 yr B. 16.309 yr C. 8.155 yr D. 25.85 yr
Mathematics
Find the product.1.5 x 0.2
A. 0.41 B. 1.7 C. 1.4 D. 0.3
Mathematics
Solve the problem.the size (in thousands) of a certain population in year x is approximated by the function  (where x = 0 corresponds to the year 1990). predict the size of the population in the year 2007.
A. About 147,040 B. About 216 C. About 216,400 D. About 1,616,096
Mathematics
Decide whether the given number is a solution of the given equation. Is -17 a solution of 17 + x = 0 ?
A. Yes B. No
Mathematics