Use the graph to answer the question.The graph shows average hourly wages for health services in a southeastern metropolitan area for a range of years. What was the rate of increase between 2004 and 2005?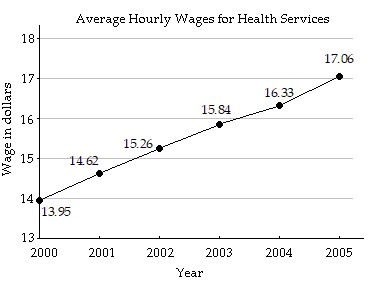
A. 0.49
B. 0.73
C. 16.33
D. 17.06
Answer: B
Mathematics
You might also like to view...
Decide whether the statement is true or false.The quotient of two irrational numbers is always irrational.
A. True B. False
Mathematics
Graph the exponential function whose equation is given. Start by using -2, -1, 0, 1, and 2 for x and finding the corresponding values for y.y =  x - 1
x - 1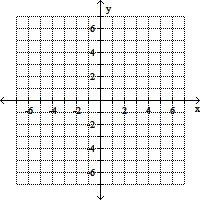
A. 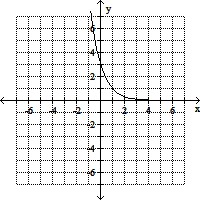
B. 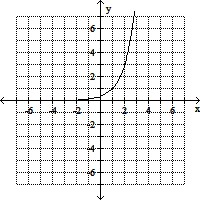
C. 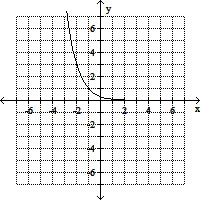
D. 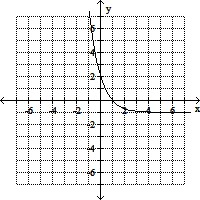
Mathematics
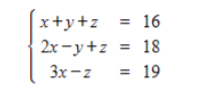
Solve the system of linear equations and check any solution algebraically.
a. 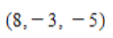
b. 
c. 
d. 
Mathematics
Evaluate the radical expressions or indicate that the root is not a real number.
A. 9 B. 3 C. -3 D. Not a real number
Mathematics