?Is the following line plot data roughly a normal distribution? Explain why or why not.
?
Data Values
Frequency
4
3
5
4
6
5
7
7
8
6
9
4
10
3
A. ?No. Most of the data values are clustered around the mean.
B. ?Yes. Most of the data values are clustered around the mean.
C. ?Yes. The mean, median, and mode are all the same.
D. ?Yes. The graph is roughly a bell-shaped curve.
E. ?No.The mean, median, and mode are all different values.
F. ?b, c, and d only
Answer: F
You might also like to view...
Use the given graph of f(x) = ax2 + bx + c to solve the specified inequality.f(x) > 0
A. no solution B. x < -4 C. -4 < x < 3 D. x < -4 or x > 3
Use modular arithmetic to find the answer.Find all x such that x ? 3 (mod 7).
A. x = 7 + 7k, where k is an integer B. x = 3 + 11k, where k is an integer C. x = 3 - 7k, where k is an integer D. x = 3 + 7k, where k is an integer
Solve the problem.A stockbroker bought 70 shares of stock for $24.37 each. What was the total amount of the purchase?
A. $1705.80 B. $1706.01 C. $1705.90 D. $1706.00
Find the amount of interest earned by the following certificates of deposit. Assume daily compounding. Round to the nearest cent.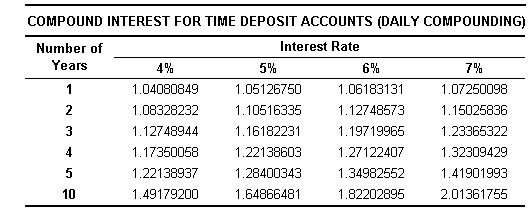 Amount: $57,624.54Interest rate: 6%Time: 10 years
A. $37,379.01 B. $47,369.04 C. $58,409.25 D. $20,158.53