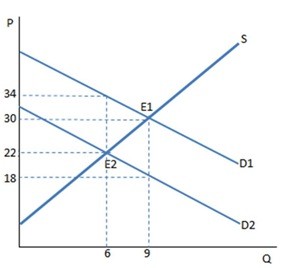
 The graph shown demonstrates a tax on buyers. Once the tax has been imposed, the sellers produce ________ units and receive ________ for each one sold.
A. 6; $34
B. 9; $18
C. 9; $30
D. 6; $22
Answer: D
You might also like to view...
Assume that the current price of a market basket of goods is $2,500 and the base year price of the same market basket is $1,340. The price index is
A) 53.6. B) 40.0. C) 138.3. D) 186.6.
Positive analysis:
A. involves the formulation and testing of hypotheses. B. involves value judgments concerning the desirability of alternative outcomes. C. weighs the fairness of a policy. D. examines if the outcome is desirable.
To determine the equilibrium price level and equilibrium level of real GDP, the aggregate demand and aggregate supply must:
A. be considered separately. B. intersect. C. be disregarded. D. be considered as a multiplier.
If a $10 billion decrease in lump-sum taxes increases equilibrium GDP by $40 billion, then:
A. the multiplier is 4. B. the MPC for this economy is .8. C. the MPC for this economy is .6. D. the multiplier is 3.