Use the graph to answer the question. 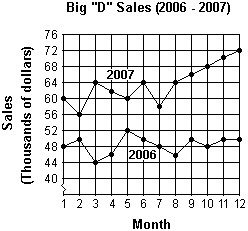 What were the total sales for the first 6 months of 2006?
A. $366,000
B. $240,000
C. $46,000
D. $290,000
Answer: D
Mathematics
You might also like to view...
Give the coordinates of the vertex and graph the equation in a window that includes the vertex.y = (x - 4)2 + 2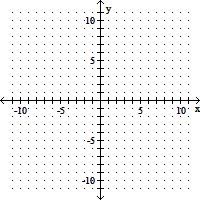
A. Vertex: (-4, 2)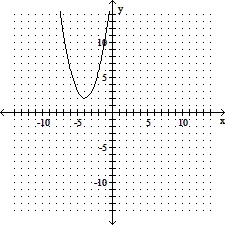
B. Vertex: (-4, -2)
C. Vertex: (4, -2)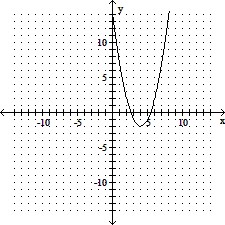
D. Vertex: (4, 2)
Mathematics
Add and simplify. +
+ 
A. - 
B. - 
C. - 
D. - 
Mathematics
Find the difference. Check by adding.92
A. 118 B. 62 C. 76 D. 66
Mathematics
Use the discriminant to classify the graph.
?
 ?
?
A. The graph is a parabola. B. The graph is a hyperbola. C. The graph is a ellipse. D. The graph is a cone. E. The graph is a circle.
Mathematics