Figure 10-7
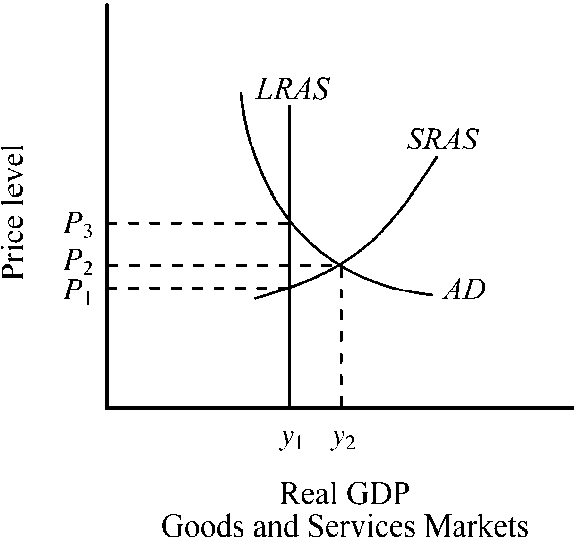
Given the aggregate demand and aggregate supply curves for the economy depicted in , the economy's output and price level are
a.
output y1 and price level P1.
b.
output y2 and price level P2
c.
output y1 and price level P3.
d.
output y2 and price level P1.
b
You might also like to view...
Suppose Sarah owns a small company that makes wedding cakes. The table below shows how Sarah's total cost varies depending on the number of wedding cakes she makes each day.Number ofCakes Per DayTotal CostPer Day0$1001$1802$2203$3004$4005$5206$660If the market for wedding cakes is perfectly competitive, and wedding cakes sell for $125 each, then Sarah should produce ________ cakes per day.
A. 3 B. 6 C. 5 D. 0
A higher discount rate generally decreases excess reserves
a. True b. False Indicate whether the statement is true or false
Monopolists in the labor market equate the marginal wage with the marginal revenue product to find the desired level of employment for a union.
Answer the following statement true (T) or false (F)
Which of the following contributes to the efficiency of markets?
A) Governments play an active role in the day-to-day operations of markets. B) Markets are able to bring about an equitable distribution of goods and services. C) Markets promote equal standards of living. D) Markets promote competition and voluntary exchange.