Use the following graph for a competitive market to answer the question below.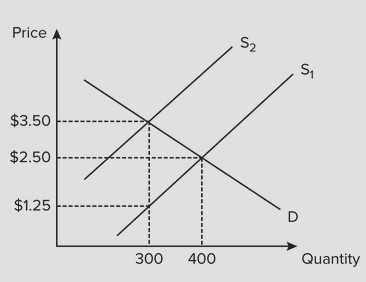 Assume the government imposes a $2.25 tax on suppliers, which results in a shift of the supply curve from S1 to S2. The amount of the tax paid by the consumer is
A. $2.25.
B. $0.
C. $1.00.
D. $1.25.
Answer: C
You might also like to view...
Which of the following statements is positive?
A. Large budget surpluses should be avoided. B. A tax cut that benefits high-income households is acceptable. C. Higher taxes are needed to support education. D. Tax increases tend to discourage saving.
When new firms enter a monopolistically competitive industry, each existing firm's
A) demand curve shifts rightward. B) demand curve shifts leftward. C) marginal cost curve shifts rightward. D) marginal cost curve shifts leftward.
What determines how much market power a firm has?
What will be an ideal response?
In an aggregate demand and aggregate supply graph, a contractionary fiscal policy can be illustrated by a:
a. Rightward shift in the aggregate demand curve b. Leftward shift in the aggregate demand curve c. Rightward shift in the aggregate supply curve d. Movement along an existing aggregate supply curve