In the above figure, which of the graphs demonstrates a curve with a decreasing slope, that is, a slope getting smaller in magnitude as x increases?
A) Figure A
B) Figure B
C) Figure C
D) Figure D
C
You might also like to view...
Use the following graph of the demand for coffee to answer the question below.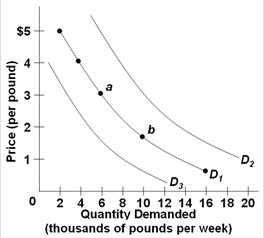 Refer to the three demand curves for coffee. Which of the following would shift the demand for coffee from D1 to D3?
A. an increase in income if coffee is a normal good B. an expected decrease in the price of coffee in the future C. a decrease in the price of coffee D. an increase in the number of buyers of coffee
Refer to Figure 2-5. If the economy is currently producing at point W, what is the opportunity cost of moving to point Y?
A) 2 million tons of paper B) 14 million tons of steel C) 9 million tons of paper D) 2 million tons of steel
Refer to the above data. If the consumer has a money income of $52 and the prices of J and K are $8 and $4 respectively, the consumer will maximize her utility by purchasing:
A) 2 units of J and 7 units of K. B) 5 units of J and 5 units of K. C) 4 units of J and 5 units of K. D) 6 units of J and 3 units of K.
After the Great Depression, until 2008, economic downturns:
A. disappeared. B. became shorter. C. continued more or less as they had prior to the Depression. D. became longer.