In this graph, when disposable income is 4,000, consumption is
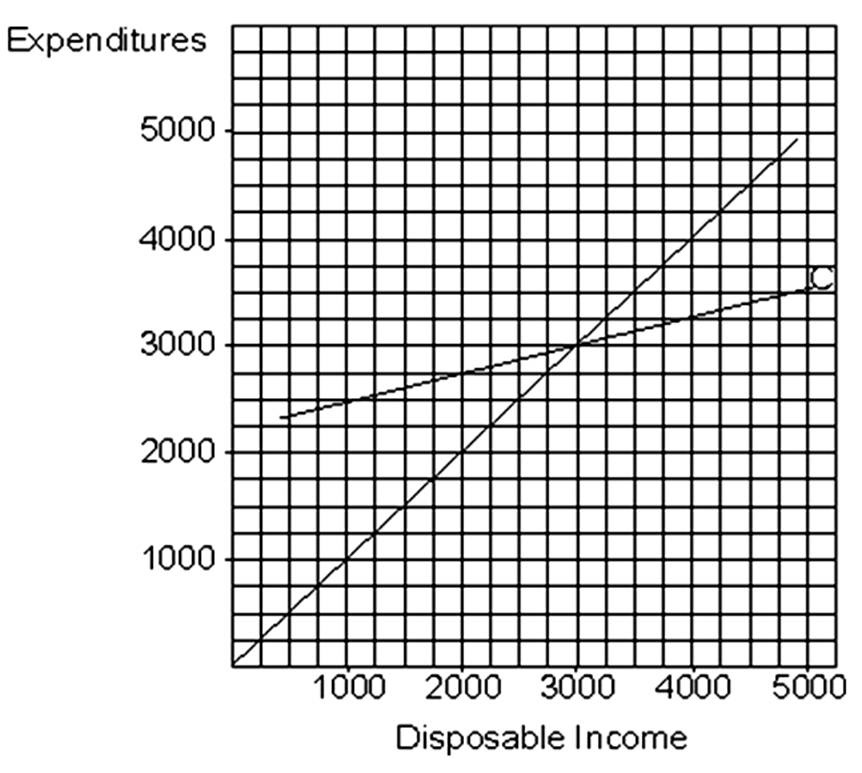
A. 4,000.
B. 3,250.
C. 2,500.
D. 1,000.
B. 3,250.
You might also like to view...
Which of the following is consistent with the law of demand?
A. An increase in the price of hamburgers causes a decrease in the quantity of hamburgers demanded. B. A decrease in the price of tacos causes sellers to want to sell less. C. A decrease in the price of egg rolls causes a decrease in the quantity of egg rolls demanded. D. An increase in the people's craving for pizza causes buyers to buy more pizza.
If a roofer offers a one-year warranty on their work, this is an example of ________.
A) a signal B) a trademark C) profit sharing D) certification
Which statement is most accurate about the real GDP per capita of different nations between 1980 and 2006?
a. The real GDP per capita of the US ranks in the middle of the other major industrialized nations. b. The US had the highest real per capita GDP at the beginning of the period, but by the end of the period many other industrialized had caught up to the US. c. The US had the highest real per capita GDP throughout the period and on average, the other major industrialized nations did not significantly close the gap. d. At the beginning of the period, the US had a real GDP per capita equal to the average of the major industrialized nations, but by 2006 the US had moved into first place.
According to the graph shown, if the market goes from equilibrium to having its price set at $10 then:
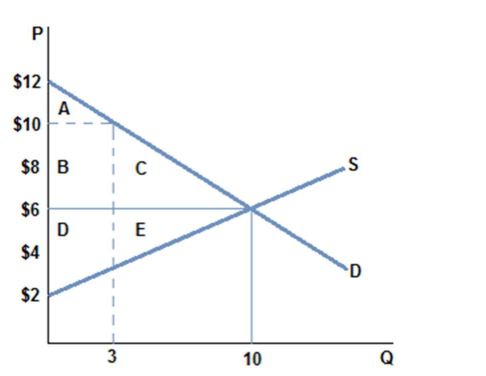
A. area (C + E) is deadweight loss.
B. area B is transferred surplus from consumers to producers.
C. $12 of surplus gets transferred from consumers to producers.
D. All of these are true.