Which line in the graph above would best illustrate the transactions demand for money curve?
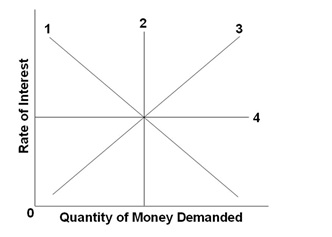
A. Line 1
B. Line 2
C. Line 3
D. Line 4
B. Line 2
You might also like to view...
The graph which represents the distribution of income in an economy is called the
A) Laffer curve. B) Lorenz curve. C) distribution curve. D) aggregate demand curve.
Often, when no player has a dominant strategy
A) there is a dominated strategy. B) there is a chance for circular reasoning. C) then another player is needed. D) then there is a competitive market.
A rightward shift in the demand curve is called:
a. an increase in income. b. a decrease in demand. c. a decrease in output. d. an increase in demand.
If the percentage change in quantity supplied is 10%, and the percentage change in price is 10%, then the supply for the good is
A. perfectly inelastic. B. elastic. C. inelastic. D. unit elastic.