The figure below illustrates the impact of an export subsidy as imposed by a large country. No imports are permitted.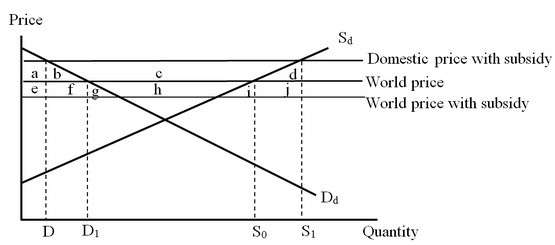 The cost to the government of the indicated export subsidy is shown by area(s)
A. (a + b + c + d + e + f + g + h + i + j)
B. (c + h)
C. (b + c + d + f + g + h + i + j)
D. (b + c + d)
Answer: C
You might also like to view...
If the Chinese constructed their national income accounts the way we do in the United States, then it would not include
a. compensation of employees of the Chinese government b. rent earned by Chinese private landowners c. corporate profit earned by the China Energy Corporation d. the purchase of housing in the Chinese capital, Beijing e. royalties earned by a Chinese poet on her new publication The East Is Red
Inflation was the nation's number-one economic worry during
A. the 1920s. B. the late 1950s. C. the early 1960s. D. the 1970s.
Figure 21-5 (a) (b) Refer to Figure 21-5. In graph (b), what is the price of good Y relative to the price of good X (i.e., PY/PX)?
a. 3 b. 1 c. 10 d. 1/3
 Refer to the above table. When the quantity of labor equals 4, what does the average product equal?
A. 72 B. 216 C. 18 D. 9