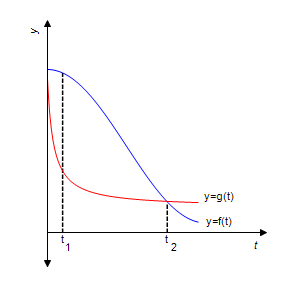
In the following figure, f(t) gives the population P?1 of a certain bacteria culture at time t after a portion of bactericide A was introduced into the population at t = 0. The graph of g gives the population P?2 of a similar bacteria culture at time t after a portion of bactericide B was introduced into the population at t = 0.
?
?
Which population is decreasing faster at t?1 and at t?2?
?
A. The populations are decreasing at the same rate at t?1, P?2 is decreasing faster at ?t?2
B. ?P?1 is decreasing faster at t?1, the populations are decreasing at the same rate at t?2
C. ?P?2 is decreasing faster at t?1, ?P?1is decreasing faster at t?2
D. P1is decreasing faster at t?1, ?P?2is decreasing faster at t?2
Answer: C
You might also like to view...
Find the number or numbers.The sum of the page numbers on the facing pages of a book is 337. Find the larger page number.
A. 164 B. 179 C. 167 D. 169
Use the accompanying table to find the solutions to the given equation on  2 cos2 ? + cos ? - 1 = 0
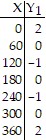 Y1 = 2(cos(X))2+cos(X)-1
A. 0° B. 120°, 240° C. 60°, 180°, 300° D. None
The publisher decided to publish a new book. He is going to sell one copy for $10. Assume that the cost of publishing is $60,000 for 1,000 copies and $250,000 for 5,000 copies. The probability of selling 1,000 copies is 0.9 and of selling 5,000 copies is 0.1. Find the publisher’s expected profit.
a. –65,000 b. 14,000 c. 1,400 d. –250,000
Solve the equation for the specified variable.P =  for t
for t
A. t = 
B. t = 
C. t = P - rA
D. t = 