Solve the problem.The following table shows the median number of hours of leisure time per week for Americans in various years. Let f(t) be the median number of leisure hours per week since 1993. Using a graphing utility, find and verify an equation of f. In which year was the median amount of leisure time the lowest?
A. f(t) = 0.05t2 - 1.31t + 26.03; 2006
B. f(t) = 0.04t2 - 1.21t + 26.03; 2008
C. f(t) = 0.04t2 - 1.21t + 26.03; 2006
D. f(t) = 0.05t2 - 1.31t + 26.03; 2008
Answer: B
You might also like to view...
Find the equation for the plane tangent to the parametrized surface S at the point P.S is the sphere r(?, ?) = 10 cos ? sin ?i + 10 sin ? sin ?j + 10 cos ?k; P is the point corresponding to  .
.
What will be an ideal response?
Provide an appropriate response.Which pair(s) of events is (are) independent? A and B given the following: P(A) = 0.4, P(B) = 0.3, P(A and B) = 0.16 C and D given the following: P(C) = 0.4, P(D) = 0.3, P(C|D) = 0.4
A. Neither pair B. Both pairs C. C and D D. A and B
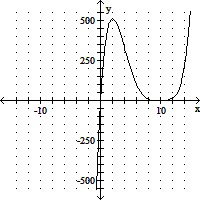
Sketch the graph and show all local extrema and inflection points.y = x 4
4
A. Local maximum: 
Local minimum: (10, 0)
Inflection points:  , (10, 0)
B. Local maximum: 
Local minimum: (10, 0)
Inflection points: 

C. Local minimum: (10, 0)
No inflection points
D. Local maximum: 
Local minimum: (10, 0)
Inflection point: 
Use the information below to determine the indicated set. U = {q, r, s, t, u, v, w, x, y, z} A = {q, s, u, w, y} B = {q, s, y, z}(A ? B)'
A. {t, v, x} B. {s, u, w} C. {r, t, u, v, w, x, z} D. {q, s, t, u, v, w, x, y}