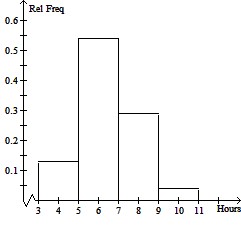
Construct a histogram for the given data. The following data are the number of hours spent preparing for a test by a sample of 24 high school students. The times (in hours) are as follows: 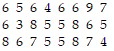 Use the given class intervals in the table below to construct a relative frequency histogram for the data.
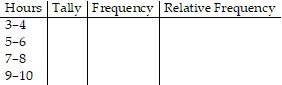
What will be an ideal response?
Mathematics
You might also like to view...
Find the first four nonzero terms in the Maclaurin series for the function.x sin(4x)
A. 4x2 +  x4 +
x4 +  x6 +
x6 +  x8 + . . .
B. 4x - 8x3 +  x5 -
x5 -  x7 + . . .
C. 4x2 -  x4 +
x4 +  x6 -
x6 -  x8 + . . .
D. 4x -  x4 +
x4 +  x6 -
x6 -  x8 + . . .
Mathematics
Answer the question.True or False.Some rational numbers are irrational.
Answer the following statement true (T) or false (F)
Mathematics
Find the area.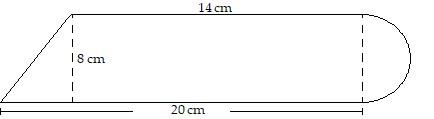
A. Not enough data B. 186.2 cm2 C. 161.1 cm2 D. 185.1 cm2
Mathematics
Divide and simplify. ÷
÷ 
A. 
B. 
C. 
D. 
Mathematics