The following graph shows average fixed costs, average variable costs, average total costs, and marginal costs of production.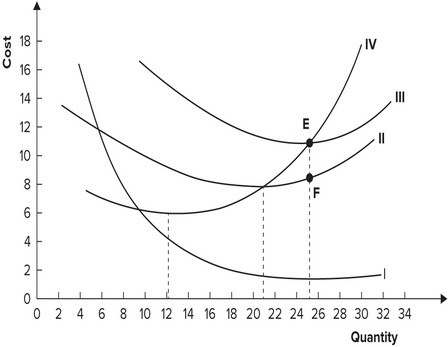 Why does the distance between curves II and III get smaller as quantity increases?
A. Average fixed cost is declining.
B. Average fixed cost is increasing.
C. Average variable cost is increasing.
D. Marginal cost is increasing.
Answer: A
You might also like to view...
Which of the following mathematical expressions represents the equation of a straight line with a slope of zero at all points on a graph with Y on the vertical axis and X on the horizontal axis?
A. Y = a + X B. X = bY C. X = a D. Y = a
For most years since 1980, the natural unemployment rate was higher in Canada than in the United States. What possible explanation for some of this difference has been suggested?
What will be an ideal response?
Refer to Table 9-13. Consider a simple economy that produces only three products: tacos, earplugs, and toothbrushes. Use the information in the table to calculate the inflation rate for 2016, as measured by the consumer price index
What will be an ideal response?
If the Fed's policy reaction function equals r = .02 + ?, where r is the real interest rate and ? is the inflation rate. If the real rate of interest is set at 5 percent, then the rate of inflation must be:
A. 4 percent. B. 2 percent. C. 3 percent. D. 1 percent.