Make a line graph of the data.The following table shows the average tuition for one semester at City X College over various years. Use time on the horizontal scale for your line graph.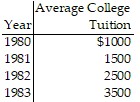
What will be an ideal response?
Answers may vary. A possible answer follows.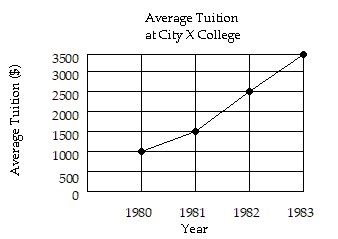
Mathematics
You might also like to view...
Use the Change-of-Base Formula and a calculator to evaluate the logarithm. Round your answer to two decimal places.log5.1 260
A. 0.29 B. 50.98 C. 2.41 D. 3.41
Mathematics
Graph the piecewise linear function.f(x) = 

A. 
B. 
C. 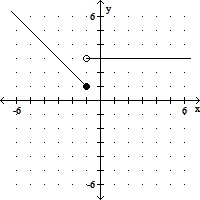
D. 
Mathematics
Evaluate the polynomial.-5x3 - 6x2 - 39for x = -2
A. -23 B. 13 C. -35 D. -33
Mathematics
Graph the function, and state its domain and range.f(x) = - - 4
- 4
A. Domain: [-5, ?); Range: (-?, -4]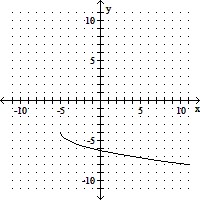
B. Domain: [-5, ?); Range: (-?, 4]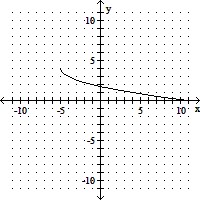
C. Domain: [5, ?); Range: (-?, -4]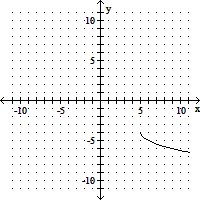
D. Domain: [5, ?); Range: (-?, 4]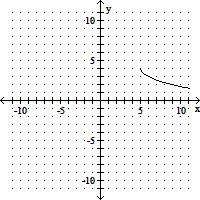
Mathematics