Exhibit 5-9 Supply and Demand Curves for Good X
?
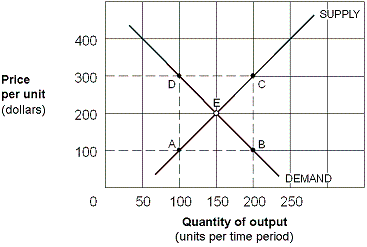
As shown in Exhibit 5-9, the price elasticity of demand for good X between points E and B is:
A. 3/7 = 0.43.
B. 7/3 = 2.33.
C. 1/2 = 0.50.
D. 1.
Answer: A
You might also like to view...
The Bureau of Economic Analysis calculates the PCE deflator ________
A) every month B) every two months C) every three months D) every year E) twice each month
A perfectly competitive firm acts as a ___________, so it calculates total revenue by multiplying the given market price by the quantity of output the firm chooses.
a. natural monopoly b. price taker c. technological monopoly d. drag on the market
Inflation tends to redistribute real income from lenders to borrowers
a. True b. False Indicate whether the statement is true or false
The use of money for exchange and trade:
A. Increases the importance of barter B. Fosters more specialization in production C. Reduces consumer sovereignty D. Raises the need for a coincidence of wants