In the Keynesian aggregate consumption-income graph, the vertical distance between the consumption function and the 45-degree line shows the:
a. amount of savings (or dissavings) at that level of disposable income.
b. amount of disposable income at that level of consumption.
c. increase in planned business investment at each level of inflation.
d. increase in income that causes each change in real GDP.
a
You might also like to view...
If social cost exceeds private cost, there is
A) underproduction of a good. B) a negative externality. C) a positive externality. D) too little economic profit in the activity.
M2 consists of M1 plus savings deposits, small time deposits, money market mutual funds, and a few minor categories.
Answer the following statement true (T) or false (F)
The graph above shows the PPC for a country that can produce oil or televisions. The straight line is the trade line and CPC if production is at Point A. Which of the following is a true statement?
A) This country should produce relatively more oil and relatively fewer televisions. B) This country should produce relatively more televisions and relatively less oil. C) This country should produce more of both goods. D) This country is producing the optimal mix of oil and televisions to maximize its income.
Refer to the information provided in Figure 9.3 below to answer the question(s) that follow. 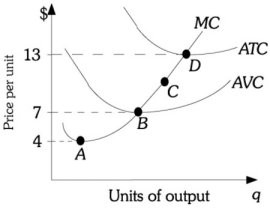 Figure 9.3Refer to Figure 9.3. This firm will ________ if price is between $7 and $13.
A. shut down in the short run, but operate in the long run B. continue to operate in the short run, but incur an economic loss C. shut down D. earn an economic profit