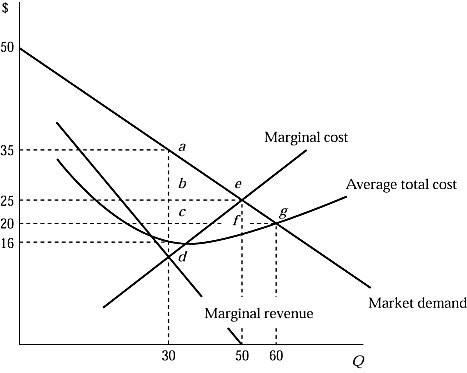
 Suppose that Figure 7.4 shows a monopolist's demand curve, marginal revenue, and its costs. The monopolist would maximize its profit by charging a price of:
A. $35.
B. $25.
C. $20.
D. $16.
Answer: A
You might also like to view...
Why are water companies considered a natural monopoly?
What will be an ideal response?
The table above shows how the number of books Katie buys each year depends on her income
a) What kind of relationship exists between Katie's income and the number of books she purchases? b) Plot the relationship between Katie's income and the number of books she purchases in the above figure. Measure income along the vertical axis and the number of books along the horizontal axis. Be sure to label the axes. c) What is the slope of the relationship between $50,000 and $70,000 of income? d) What is the slope of the relationship between $90,000 and $110,000 of income? e) Comment on the similarity or dissimilarity of your answers to parts (c) and (d).
In the above figure, Reggie's budget line rotates outward from BL1 to BL2. He initially consumes at point A. If his new consumption bundle is at point B, this implies that kiwi fruit and mangoes are
A) both lower in price. B) both inferior goods. C) neither substitutes nor complements. D) None of the above answers is correct.
Credit Suisse, Goldman Sachs, and Lazard Freres are examples of
A) commercial banks. B) corporations. C) non-bank financial institutions, such as insurance companies, pension funds, and mutual funds. This includes investment banks, which specialize in underwriting sales of stocks and bonds by corporations and in some cases governments. D) central banks and other government agencies. E) non-profit organizations.