The above figure shows the marginal private cost curve, marginal social cost curve, and marginal social benefit curve for cod, a common resource. The market equilibrium with no government intervention is ________
A) 0 tons per week
B) 400 tons per week
C) 300 tons per week
D) None of the above answers is correct.
B
You might also like to view...
Which of the following changes would NOT shift the aggregate demand curve?
A) a change in fiscal policy B) a change in monetary policy C) a change in expectations about future income D) an increase in technology
The deadweight loss of taxation from an income tax is because of _____
a. the inclusion of savings in the tax base b. the Laffer curve c. the income effect d. the substitution effect
Refer to the graph shown for a small country that is a price taker internationally.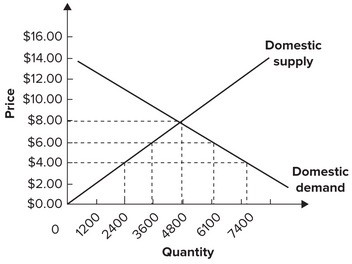 Assume the foreign supply of this product is perfectly elastic at a price of $4 per unit. Starting from a free trade equilibrium, a tariff in the amount of $2 per unit would be expected to cause domestic consumption to:
A. decrease from 7,400 to 6,100. B. decrease from 4,800 to 3,600. C. increase from 2,400 to 7,400. D. increase from 2,400 to 3,600.
Specialization in production and then trading with other countries
A. Change the mix of output for each country and increase total world output. B. Mean that every citizen in every country is better off. C. Increase the standard of living for rich countries but not for poor countries. D. Change the mix of output for rich countries but not for poor countries.