Find the indicated probability.A study was recently done that emphasized the problem we all face with drinking and driving. Four hundred accidents that occurred on a Saturday night were analyzed. Two items noted were the number of vehicles involved and whether alcohol played a role in the accident. The numbers are shown below: Number of Vehicles Involved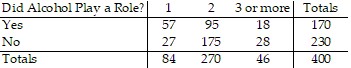 If an accident is selected at random, what is the probability that it involved alcohol or a single car? Give your answer as a fraction.
A. 
B. 
C. 
D. 
Answer: D
You might also like to view...
Identify the radicand.xy2
A. 
B. x + 4
C. 
D. xy2
Answer the question.Andrew creates a bar graph to show the increase in his company's sales. He wants to show the milestones - years in which sales reached 10 million, 20 million, 30 million, 40 million, and 50 million dollars respectively. The data are shown in the table below:  In the graph, Andrew draws 5 equally spaced bars of heights 1 in, 2 in, 3 in, 4 in, and 5 in respectively. The height of each bar corresponds to the amount of sales. He labels each bar with the corresponding year (1975, 1985, 1993, 1999, 2003 respectively). Why is the graph misleading?
What will be an ideal response?
Simplify. Assume that all variables are nonzero.
A. Undefined B. 15 C. 0 D. 1
Find the standard form of the equation of the ellipse with the given characteristics.
?
Foci:  ; major axis of length 12.
?
; major axis of length 12.
?
A. 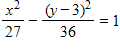
B. 
C. 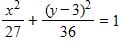
D. 
E. 