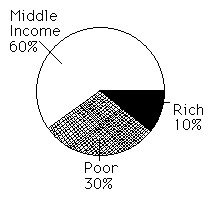
Draw a circle graph showing each percent.A study showed that 60% of households in a certain state are considered middle income, 30% are considered poor, and 10% are considered rich. 
What will be an ideal response?
| ? | Income Study |
Mathematics
You might also like to view...
Let A and B be sets with cardinal numbers, n(A) = a and n(B) = b, respectively. Decide whether the statement is true or false.n(A ? B) = n(A) - n(B)
A. True B. False
Mathematics
Sets A, B, and C are given. Find the indicated set. A = {-8, -3, -1, 2, 5}, B = {-3, 2, 5, 7}, and C = {-1, 4, 9}A ? C
A. {-1} B. {4, 6, 7, 9} C. {-8, -3, -1, 2, 4, 5, 7, 9} D. {-3, -1, 2, 5, 7, 9}
Mathematics
Solve the problem.Leon Harding receives proceeds of $4083 after signing a  note for
  Find the discount rate. Round to the nearest tenth.
A. 3.1% B. 2.6% C. 0.4% D. 5.1%
Mathematics
Evaluate. Assume u > 0 when ln u appears. 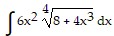
A. - 4(8 + 4x3)-3/4 + C
B. 6(8 + 4x3)5/4 + C
C.  (8 + 4x3)5/4 + C
D.  (8 + 4x3)5/4 + C
Mathematics