Simplify.
A. 2
B. 2(a - 5b)
C. 1
D. 
Answer: A
You might also like to view...
Use the graph to answer the question.This double-bar graph shows the number of male (M) and female (F) athletes at a university over a four-year period. 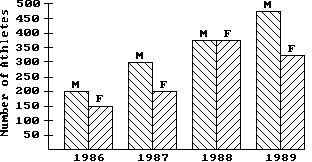 Compare the trend in the number of male athletes during the four-year period and the trend in the number of female athletes during the four-year period .
A. The number of male athletes and the number of female athletes increased steadily over the four-year period. B. The number of male athletes increased steadily over the four-year period. The number of female athletes increased in 1987 then decreased again in 1988 and 1989. C. The number of female athletes increased steadily over the four-year period. The number of male athletes increased to a peak in 1988 and then decreased again in 1989. D. The number of male athletes increased steadily over the four-year period. The number of female athletes increased to a peak in 1988 and then decreased again in 1989.
Use the limit comparison test to determine if the series converges or diverges.
A. converges B. Diverges
Divide. Write the answer in lowest terms and as a whole or mixed number where possible.28 ÷ 
A. 21
B. 37
C. 
D. 7
If  with B in QII, find
?
with B in QII, find
?

What will be an ideal response?