Use the graph to answer the question.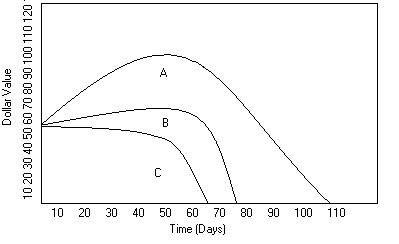 Mike decides to buy shares of companies A, B, and C, which were initially selling for the same price. The changes in each stock's value are shown in the graph above. At its peak, stock A was valued at approximately how much more than either B or C?
A. $15
B. $10
C. $30
D. $35
Answer: D
Mathematics
You might also like to view...
Evaluate the integral using the given substitution.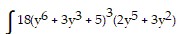 dy , u = y6 + 3y3 + 5
A.  (y6 + 3y3 + 5)4(10y4 + 6y) + C
B.  (y6 + 3y3 + 5)4 + C
C. 18(y6 + 3y3 + 5)2 + C
D.  (y6 + 3y3 + 5)4 + C
Mathematics
Eliminate the parameter to find a Cartesian equation of the curve.
 FIGURE 1.png)
Mathematics
Find the product.(3y2 - 2y - 1)(y2 + 4y - 3)
A. 3y4 + 12y3 - 17y2 + 2y + 3 B. 3y4 + 10y3 - 17y2 + 2y + 3 C. 3y4 + 12y3 - 18y2 + 2y + 3 D. 3y4 + 10y3 - 18y2 + 2y + 3
Mathematics
Divide.
A. 1157.364 B. 11,573.64 C. 11.57364 D. 1.157364
Mathematics