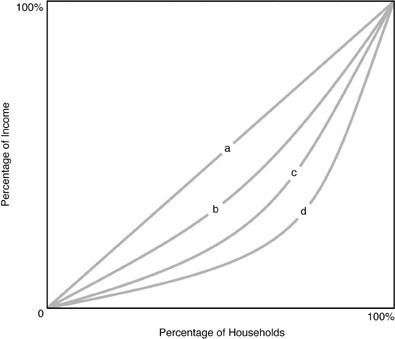
 Each of the curves plotted in the graph shown in the above figure is known as a
A. Phillips curve.
B. Keynesian curve.
C. Lorenz curve.
D. Laffer curve.
Answer: C
You might also like to view...
Economic incentives are designed to make individual self-interest coincide with social interest. According to economists, which of the following methods of pollution control best uses economic incentives to reduce pollution?
A) imposing quantitative limits on the amount of pollution and imposing a penalty for non-compliance with these limits B) rewarding environmental groups for monitoring the activities of private firms that produce products which generate pollution C) requiring the installation of specific pollution control devices D) instituting a system of tradable emission allowances
Which of the following is NOT a restriction the government imposes to keep potential entrants out of a market?
A) patents B) tariffs C) assistance with opening new firms D) copyrights
Any output combination outside the production possibilities curve is attainable in the current period only if prices decrease
a. True b. False Indicate whether the statement is true or false
Which of the following would raise the wages of scientists and engineers?
A. An increase in the demand for innovative activities B. A decline in the level of legal protection of property rights over new inventions C. The immigration of skilled scientists and engineers from other nations D. A decline in the rate of return on research and development