Solve the problem.Suppose that during a certain step in a chemical manufacturing process the amount of hydrogen chloride dissolved in a solution, measured in parts per million (ppm), is related to the elapsed time measured from the beginning of the step. Use the following table as a representation of this relationship. Make a scatterplot of the data. What is happening to the amount of hydrogen chloride in solution during this time frame?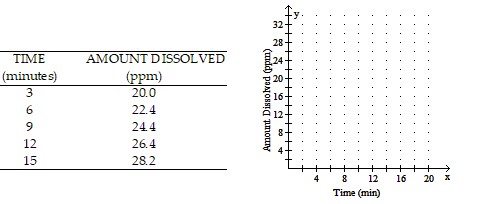
A. The amount of hydrogen chloride dissolved
decreased as time elapsed.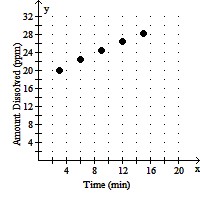
B. The amount of hydrogen chloride dissolved
increased as time elapsed.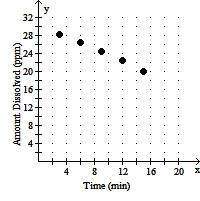
C. The amount of hydrogen chloride dissolved
increased as time elapsed.
D. The amount of hydrogen chloride dissolved
increased as time elapsed.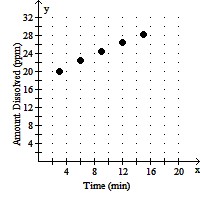
Answer: D
You might also like to view...
Add or subtract, if possible. Assume that all variables represent non-negative values. Simplify your answer. 3 + 6
+ 6
A. 9
B. 3 + 6
+ 6
C. 18
D. 9
Use the shell method to find the volume of the solid generated by revolving the region bounded by the given curves and lines about the y-axis.y = 3x2, y = 3
A.  ?
?
B.  ?
?
C.  ?
?
D.  ?
?
Solve the problem.Use Newton's method to estimate the solutions of the equation  . Start with
  for the right-hand solution and with x0 = -1.5 for the solution on the left. Then, in each case find x2.
What will be an ideal response?
Estimate any solutions of the equation or system by referring to the graphs shown.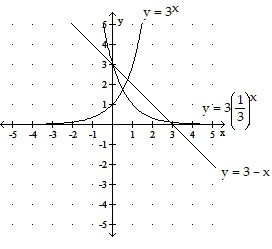 3x = 3
 x
x
A. 0.5 B. 0.7 C. 0 D. 2.9