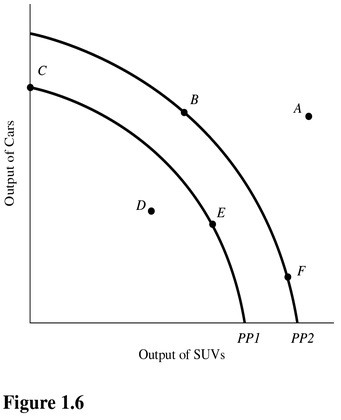
 Using Figure 1.6, if an economy has the capacity to produce represented by PP1, then point E represents
A. A change in technology.
B. An efficient use of resources.
C. A combination of cars and SUVs that is not attainable.
D. A constant trade-off between cars and SUVs.
Answer: B
You might also like to view...
If desired spending exceeds output, then firms:
A) accumulate their inventories and cut production. B) deplete their inventories and cut production. C) deplete their inventories and increase production. D) accumulate their inventories and increase production.
Your textbook plots the estimated regression function produced by the probit regression of deny on P/I ratio The estimated probit regression function has a stretched "S" shape given that the coefficient on the P/I ratio is positive. Consider a probit regression function with a negative coefficient. The shape would
A) resemble an inverted "S" shape (for low values of X, the predicted probability of Y would approach 1) B) not exist since probabilities cannot be negative C) remain the "S" shape as with a positive slope coefficient D) would have to be estimated with a logit function
Which of the following is a stock variable?
a. Saving b. Consumption c. Income d. Investment e. Money
Which of the following is NOT a beneficial aspect of trade?
A. Someone who owns a good of relatively little value can trade it for something they value more. B. Trade frees people from the need to produce everything themselves. C. Trade allows people to specialize in whatever they do best. D. Trade eliminates the problem of scarcity.