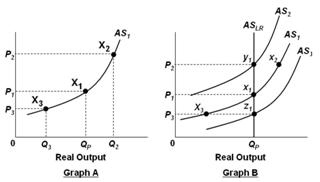
Refer to the graphs below. In Graph A, an increase in the price level from P1 to P2 will cause:
In the graphs below, QP refers to the economy's potential output level.
A. The nation's unemployment rate to be greater than the natural rate of unemployment
B. The nation's unemployment rate to be less than the natural rate of unemployment
C. Product prices to decrease
D. Profits to decrease
B. The nation's unemployment rate to be less than the natural rate of unemployment
You might also like to view...
One of the conditions mentioned in our formulation of the Ramsey Rule is that goods be unrelated in consumption. Do you think this is a reasonable assumption? If this condition does not hold, will the Ramsey Rule still work?
What will be an ideal response?
When the money market is drawn with the value of money on the vertical axis, a decrease in the money supply leads people to
a. spend more so the value of a dollar rises. b. spend more so the value of a dollar falls. c. spend less so the value of a dollar rises. d. spend less so the value of a dollar falls.
From 1995 to 2001, the debt-GDP ratio in the United States
A. fell from 1995 to 1998, then rose sharply. B. steadily increased. C. steadily fell. D. was about constant.
A firm in a perfectly competitive industry can raise its price above the market price to increase revenue.
Answer the following statement true (T) or false (F)