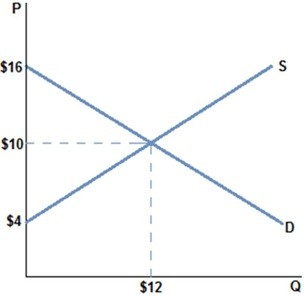
 According to the graph shown:
A. total surplus is smaller than producer surplus.
B. total surplus is smaller than consumer surplus.
C. producer surplus is greater than consumer surplus.
D. consumer surplus is greater than producer surplus.
Answer: D
You might also like to view...
Other things being constant, if the marginal propensity to save (MPS) is 0.1, and private investment spending falls by $100 million, then real Gross Domestic Product (GDP)
A) increases by $1 billion. B) increases by $90 million. C) decreases by $1 billion. D) decreases by $10 million.
If a binding price ceiling were placed in the market in the graph shown:
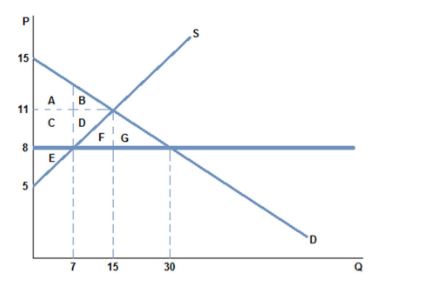
A. quantity demanded would exceed quantity supplied.
B. quantity supplied would exceed quantity demanded.
C. the demand curve would have to shift.
D. the supply curve would have to shift.
In the markets for goods and services in the circular-flow diagram,
a. households and firms are both buyers. b. households and firms are both sellers. c. households are buyers and firms are sellers. d. households are sellers and firms are buyers.
If workers expect inflation, and negotiate wage increases that exactly match price increases, the result is a
A. horizontal aggregate supply curve at the level of potential GDP. B. vertical aggregate supply curve at the level of potential GDP. C. horizontal aggregate demand curve at the level of potential GDP. D. vertical aggregate demand curve at the level of potential GDP.