The stack plot below shows the value of each of Danny's investments. The stack plot contains three regions. The uppermost unshaded region represents the value of Danny's investment in individual stocks. The center shaded region represents the value of Danny's investment in mutual funds and the bottom region in black represents the value of Danny's investment in a CD. The thickness of a region at a particular time tells you its value at that time.  Use the graph to answer the question.In which year was the total value of Danny's investments the greatest?
A. year 8
B. year 4
C. year 0
D. year 5
Answer: D
Mathematics
You might also like to view...
Add or subtract as indicated. Write the answer in simplest form. -
- 
A. 
B. 
C. 
D. 
Mathematics
Select the graph of the function below. Include two full periods.
?
 ?
?
A. ?
B. ??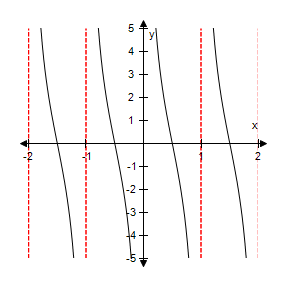
C. ?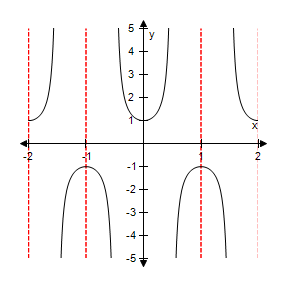
D. ?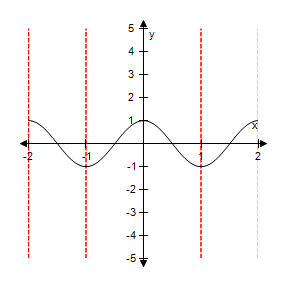
E. ?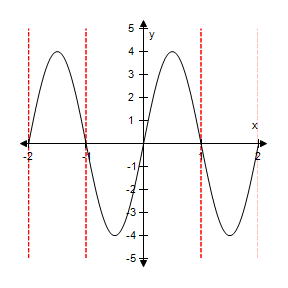
Mathematics
Translate the English statement into an inequality.The cost of shoes must be less than $59. (Use the variable c for the cost.)
A. c ? 59 B. c < 59 C. c > 59 D. c ? 59
Mathematics
Evaluate. , when x = 10 and y = 30
A. 3 B. 6 C. 4 D. 5
Mathematics