Solve the problem.Suppose that during a certain step in a chemical manufacturing process the amount of hydrogen sulfide dissolved in a solution, measured in parts per million (ppm), is related to the elapsed time measured from the beginning of the step. Use the following table as a representation of this relationship. Represent the data in the table graphically with elapsed time on the horizontal axis and the amount of dissolved hydrogen sulfide on the vertical axis. What general trend do the data reflect?
A. With increasing elapsed time, the amount
of dissolved hydrogen sulfide decreases.
B. With increasing elapsed time, the amount
of dissolved hydrogen sulfide increases.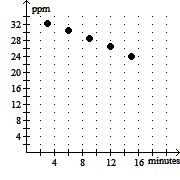
C. With increasing elapsed time, the amount
of dissolved hydrogen sulfide increases.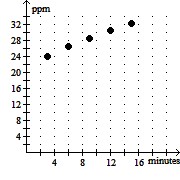
D. There is no apparent trend in the data.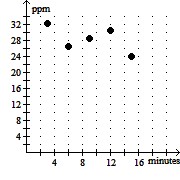
Answer: C
Mathematics
You might also like to view...
Complete.0.078 m2 = _______ cm2
A. 7,800 B. 78 C. 7.8 D. 780
Mathematics
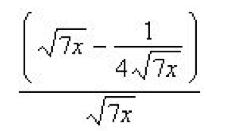
Simplify the complex fraction.
a. 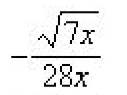
b. 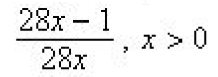
c. 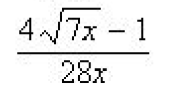
d. 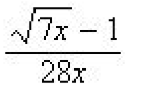
e. 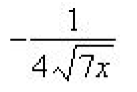
Mathematics
![]() _____
_____
A. 11 B. 24 C. 336 D. 498
Mathematics
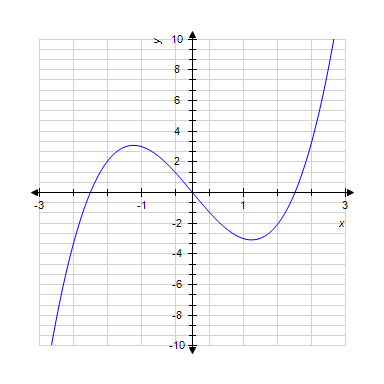
The graph of the second derivative,  , is given.
?
?
Determine the x-coordinates of all points of inflection of f(x), if any. (Assume that f(x) is defined and continuous everywhere in  .)
.)
?
A. 
B. 
C. 
D. 
E. 
Mathematics