The following table shows the number C, in millions, of cars sold in the U.S. t years after 2005. Based on the regression equation, how would you expect sales to be affected over a 5-year period?
t 0 1 3 5 C 5.56 5.46 5.27 4.56?
?
A. Sales would decrease by 0.19 million cars.
B. Sales would increase by 0.95 million cars.
C. Sales would increase by 0.19 million cars.
D. Sales would decrease by 0.95 million cars.
Answer: D
Mathematics
You might also like to view...
Using Green's Theorem, compute the counterclockwise circulation of F around the closed curve C.F = sin 3yi + cos 9xj; C is the rectangle with vertices at (0, 0),  ,
,  , and
, and 
A. 0
B.  ?
?
C. -  ?
?
D. -  ?
?
Mathematics
Multiply by first changing the decimal to a fraction. Multiply the fractions; then write the answer as a decimal.0.2 × 0.9
A. 1.8 B. 0.18 C. 0.0018 D. 0.018
Mathematics
Use the shape of the graph to name the function.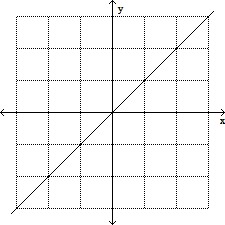
A. Constant function B. Absolute value function C. Square root function D. Identity function
Mathematics
Find the larger number.0 and 82
A. 0 B. 82
Mathematics