Make a line graph of the data.The following table gives the total amount of precipitation during the given months. Use time on the horizontal scale for your line graph.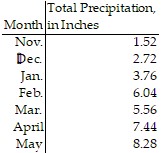
What will be an ideal response?
Answers may vary. A possible answer follows.
You might also like to view...
Solve the problem.The number of family practice physicians in a certain country can be approximated by the equation  where x is the number of years since 2010 and y is the number of physicians in thousands. Write the equation in slope-intercept form and identify the slope and y-intercept. Then, explain the meaning of the slope in this specific equation.
A. y =  x + 510, m =
  , y-intercept is (0, 510); The slope is the amount of decrease in thousands in the number of family practice physicians in this country per year.
B. y =  x + 51, m =
  , y-intercept is (0, 51); The slope is the amount of increase in thousands in the number of family practice physicians in this country per year.
C. y =  x + 510, m =
  , y-intercept is (0, 510); The slope is the amount of increase in thousands in the number of family practice physicians in this country per year.
D. y =  x + 51, m =
  , y-intercept is (0, 51); The slope is the amount of decrease in thousands in the number of family practice physicians in this country per year.
Evaluate the expression without a calculator.-(40) + (-14)0
A. -10 B. -2 C. 0 D. 1
Graph the inequality.-2x - 5y ? -10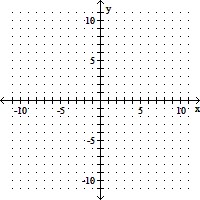
A. 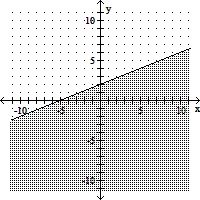
B. 
C. 
D. 
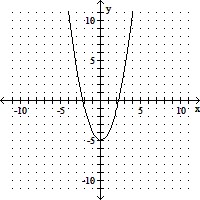
Graph the parabola.x = y2 + 5
A. 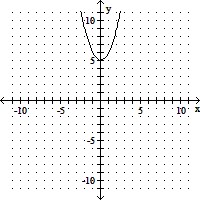
B. 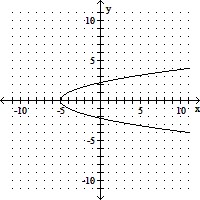
C. 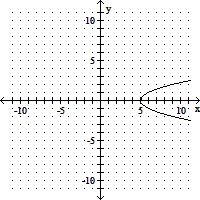
D.