Provide an appropriate response.Ryan would like to compare how his various investment choices within his company's 401(k) plan have performed over the last year. This would be best done using a:
A. frequency distribution
B. line graph
C. circle graph
D. bar graph
Answer: D
Mathematics
You might also like to view...
Solve the inequality and graph the solution set. > 8
> 8![]()
A.  ?
? 
![]()
B. 
![]()
C. 
![]()
D.  ?
? 
![]()
Mathematics
Perform the indicated operation for the given f(x) and g(x). ,
, 
 Find
Find 
A. -8 B. 12 C. -4 D. 4
Mathematics
Find the product using FOIL.(2x - 3)(2x + 3)
A. 4x2 + 12x - 9 B. 4x2 - 12x - 9 C. 4x2 - 9 D. 2x2 + 12x - 9
Mathematics
Graph the inequality.4x + y > -4
A. 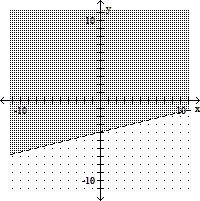
B. 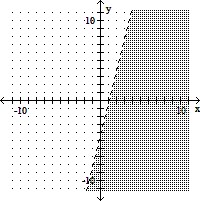
C. 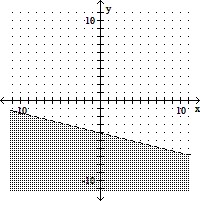
D. 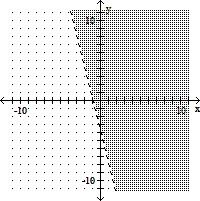
Mathematics