Solve the problem.Suppose that the speed of a car, measured in miles per hour (mph), is monitored for some short period of time after the driver applies the brakes. The following table and graph relate the speed of the car to the amount of time, measured in seconds (sec), elapsed from the moment that the brakes are applied.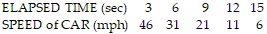
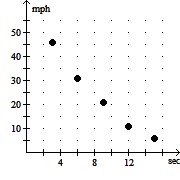 What general trend do the data reflect? In which of the time intervals does the speed change the most?
A. With increasing elapsed time, the speed decreases. The speed changes most during the time interval from 12 seconds to 15 seconds.
B. With increasing elapsed time, the speed decreases. The speed changes most during the time interval from 3 seconds to 6 seconds.
C. With increasing elapsed time, the speed increases. The speed changes most during the time interval from 12 seconds to 15 seconds.
D. With increasing elapsed time, the speed increases. The speed changes most during the time interval from 3 seconds to 6 seconds.
Answer: B
You might also like to view...
Decide whether the expression is or is not an identity.cos  tan
tan  =
= 
A. Not an identity B. Identity
Multiply.(2 -  )(4 -
)(4 -  )
)
A. 8 - 5x
B. 8 - 6 - x
- x
C. 8 - 5
D. 8 - 6 + x
+ x
Factor completely. If the polynomial cannot be factored, say it is prime.x3 + 30x2 + 225x
A. x(x - 15)2 B. x(x + 15)2 C. x(x + 15)(x - 15) D. prime
Write the word statement in symbols.Twelve is less than or equal to eight plus five.
A. 12 + 8 ? 5 B. 8 + 5 ? 12 C. 12 < 8 + 5 D. 12 ? 8 + 5